Un outil appelé nagiostats est inclus dans la distribution de Nagios®. Il est compilé et installé avec le démon principal de Nagios®.
L’outil nagiostat vous permet d’obtenir diverses informations sur le processus Nagios®. Vous pouvez obtenir les informations soit dans un format compatible avec MRTG soit dans un format intelligible.
Vous pouvez lancer l’outil nagiostats avec l’option --help pour avoir les informations d’utilisation :
[nagios@lanman ~]# /usr/local/nagios/bin/nagiostats --help

Nagios® Stats 2.0a1
Copyright (c) 2003 Ethan Galstad (nagios@nagios.org)
Last Modified: 11-18-2003
License: GPL

Usage: /usr/local/nagios/bin/nagiostats [options]

Startup:
 -V, --version      display program version information and exit.
 -L, --license      display license information and exit.
 -h, --help         display usage information and exit.

Input file:
 -c, --config=FILE  specifies location of main Nagios® config file.

Output:
 -m, --mrtg         display output in MRTG compatible format.
 -d, --data=VARS    comma-seperated list of variables to output in MRTG
                    (or compatible) format.  See possible values below.
                    Percentages are rounded, times are in milliseconds.

MRTG DATA VARIABLES (-d option):
 NUMSERVICES        total number of services.
 NUMHOSTS           total number of services.
 NUMSVCOK           number of services OK.
 NUMSVCWARN         number of services WARNING.
 NUMSVCUNKN         number of services UNKNOWN.
 NUMSVCCRIT         number of services CRITICAL.
 NUMSVCPROB         number of service problems (WARNING, UNKNOWN or CRITIAL).
 NUMHSTUP           number of hosts UP.
 NUMHSTDOWN         number of hosts DOWN.
 NUMHSTUNR          number of hosts UNREACHABLE.
 NUMHSTPROB         number of host problems (DOWN or UNREACHABLE).
 xxxACTSVCLAT       MIN/MAX/AVG active service check latency (ms).
 xxxACTSVCEXT       MIN/MAX/AVG active service check execution time (ms).
 xxxACTSVCPSC       MIN/MAX/AVG active service check % state change.
 xxxPSVSVCPSC       MIN/MAX/AVG passive service check % state change.
 xxxSVCPSC          MIN/MAX/AVG service check % state change.
 xxxACTHSTLAT       MIN/MAX/AVG active host check latency (ms).
 xxxACTHSTEXT       MIN/MAX/AVG active host check execution time (ms).
 xxxACTHSTPSC       MIN/MAX/AVG active host check % state change.
 xxxPSVHSTPSC       MIN/MAX/AVG passive host check % state change.
 xxxHSTPSC          MIN/MAX/AVG host check % state change.
 NUMACTHSTCHKxM    number of active host checks in last 1/5/15/60 minutes.
 NUMPSVHSTCHKxM    number of passive host checks in last 1/5/15/60 minutes.
 NUMACTSVCCHKxM    number of active service checks in last 1/5/15/60 minutes.
 NUMPSVSVCCHKxM    number of passive service checks in last 1/5/15/60 minutes.

 Note: Replace x's in MRTG variable names with 'MIN', 'MAX', 'AVG', or the
       the appropriate number (i.e. '1', '5', '15', or '60').

[nagios@lanman ~]#
Pour une utilisation normale, lancez l’outil nagiostat, en spécifiant uniquement le chemin du fichier de configuration en argument, comme suit :
[nagios@lanman ~]# /usr/local/nagios/bin/nagiostats -c /usr/local/nagios/etc/nagios.cfg

Nagios® Stats 2.0a1
Copyright (c) 2003 Ethan Galstad (nagios@nagios.org)
Last Modified: 11-18-2003
License: GPL

CURRENT STATUS DATA
----------------------------------------------------
Status File:                          /usr/local/nagios/var/status.dat
Status File Age:                      0d 0h 0m 13s
Status File Version:                  2.0-very-pre-alpha

Program Running Time:                 14d 17h 19m 13s

Total Services:                       32
Services Checked:                     32
Services Scheduled:                   29
Active Service Checks:                29
Passive Service Checks:               3
Total Service State Change:           0.000 / 65.530 / 2.930 %
Active Service Latency:               0.048 / 14.837 / 1.035 %
Active Service Execution Time:        0.076 / 60.006 / 4.301 sec
Active Service State Change:          0.000 / 10.530 / 0.762 %
Active Services Last 1/5/15/60 min:   1 / 13 / 29 / 29
Passive Service State Change:         0.000 / 65.530 / 23.883 %
Passive Services Last 1/5/15/60 min:  0 / 0 / 0 / 0
Services Ok/Warn/Unk/Crit:            23 / 5 / 1 / 3
Services Flapping:                    1
Services In Downtime:                 0

Total Hosts:                          9
Hosts Checked:                        9
Hosts Scheduled:                      9
Active Host Checks:                   9
Passive Host Checks:                  0
Total Host State Change:              0.000 / 28.420 / 4.034 %
Active Host Latency:                  0.000 / 15.741 / 5.443 %
Active Host Execution Time:           1.022 / 10.032 / 3.047 sec
Active Host State Change:             0.000 / 28.420 / 4.034 %
Active Hosts Last 1/5/15/60 min:      0 / 8 / 9 / 9
Passive Host State Change:            0.000 / 0.000 / 0.000 %
Passive Hosts Last 1/5/15/60 min:     0 / 0 / 0 / 0
Hosts Up/Down/Unreach:                7 / 1 / 1
Hosts Flapping:                       0
Hosts In Downtime:                    0


[nagios@lanman ~]#
Comme vous pouvez le constater, l’outil affiche un bon nombre de mesures concernant le processus Nagios®. Les mesures qui ont des valeurs multiples sont (sauf mention contraire) les valeurs min, max et moyenne pour cette mesure particulière.
Vous pouvez utiliser l’outil nagiostat pour afficher diverses mesures de Nagios® avec MRTG (ou tout autre programme compatible). Pour cela, lancez nagiostat en utilisant les arguments --mrtg et --data. L’option --data est utilisée pour spécifier que les statistiques sont destinées à être représentées graphiquement. Les valeurs possibles pour l’option --data sont listées en lançant l’outil nagiostat avec l’option--help.
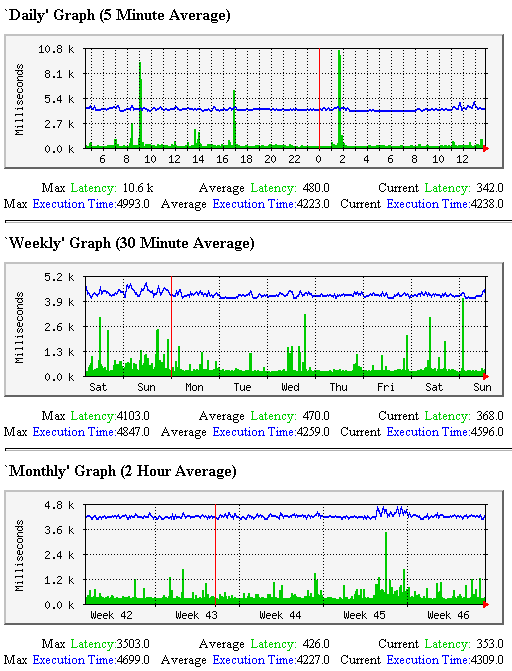
Voici un extrait de fichier de configuration MRTG utilisé par l’outil nagiostat pour représenter graphiquement le temps moyen de latence et d’exécution d’un service.
# Service Latency and Execution Time Target[nagios-a]: `/usr/local/nagios/bin/nagiostats --mrtg --data=AVGACTSVCLAT,AVGACTSVCEXT` MaxBytes[nagios-a]: 100000 Title[nagios-a]: Average Service Check Latency and Execution Time PageTop[nagios-a]: <H1>Average Service Check Latency and Execution Time</H1> Options[nagios-a]: growright,gauge,nopercent YLegend[nagios-a]: Milliseconds ShortLegend[nagios-a]: LegendI[nagios-a]: Latency: LegendO[nagios-a]: Execution Time: Legend1[nagios-a]: Latency Legend2[nagios-a]: Execution Time Legend3[nagios-a]: Maximal 5 Minute Latency Legend4[nagios-a]: Maximal 5 Minute Execution Time
Les graphes MRTG générés par l’extrait de configuration
ci-dessus ressemblent à ceci :